Network Analysis: Access to Duke Forest
Lab overview
In this brief lab exercise, we explore some of the analysis that ESRI's network analysis can do. We'll do this using the streets network dataset provided by ESRI and apply the Network Analyst to explore questions relating to access to the Duke Forest via it various gate locations.
The goal of these exercises are not to make you feel like you are experts in network analysis but rather expose you to the types of questions that this type of analysis can answer. It will also provide you with a quick introduction to how network analyses are done in ArcGIS. If this lab seems too fast-paced, I recommend you download and walk through Networks Tutorial 1 on Sakai. It provides a much more in-depth and detailed guide to getting starting with Network Analyses.
Assignment
Unlike the previous "project" labs, this short lab asks several specific questions to check that you are performing the analyses correctly. The assignment is simply to provide answers to these questions.
Preparing for analysis
- Download and unzip the DistanceToDukeForest.zip file to your
V:drive. This file contains a preformatted workspace containing almost all the data you need. The one exception is the Streets network dataset which is too large to distribute via GitHub or Sakai. Instead, we'll use a local copy (instructions below). - Open the
DistanceToDukeForest.mxdmap document . Add a basemap if you'd like (OpenStreetMap works well here...) - Add the Streets Network Layer. If you are on an EH1004 machine, look for the layer in
C:\Temp\ESRIStreets. If it's not there, the data set is onW:\761_data, but it will be faster if you copy it to your local hard drive. - Enable the Network Analysis extension (via the
Customize>Extensionsmenu). - Add the Network Analysis toolbar (via the
Customize>Toolbarsmenu). - Save your map and begin with the exercises below.
♦ Exercise 1: Which way to the closest Duke Forest gate?
You are hankering for a jog in the woods. The Al Buehler trail is not going to do it this time, but somewhere in the Duke Forest will heed your need. But which gate can you get to the fastest? How do you get there? Google Maps doesn't have the locations of the Duke Forest access points so that won't do. However, you recall that you have a shapefile of the gate locations and ArcGIS loaded on your laptop. Time to hone your network analysis skills to help you find the closest Duke Forest path...
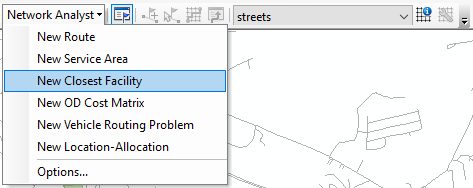
This is a "Closest Facility" question. So, create a Closest Facility network analysis layer to your map using the Network analysis toolbar.

This will add the layer to your map's table of contents.
Next, add the Network Analysis window using the
 button on the Network Analyst toolbar.
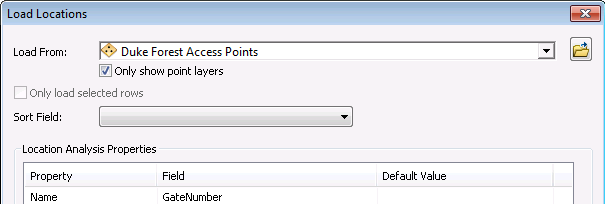
- Load the features from the Duke Forest Access Points layer as Facilities in your Closest Facility NA layer by right clicking on
Facilitiesand selectingLoad locations. Set the Name property to the GateNumber field.

Add your address (9 Circuit Dr., Durham, NC) as an incident. To do this, right click on
Indicdentsand selectFind Address. Then type in the address and clickfind. Then right-click the one with the highest score and selectAdd as a Network Analyst Object.Solve to find the fastest route to a Duke Forest gate using the Solve button in the NA toolbar.
Examine the attribute table for the
Routesfeatures in yourClosest Facilityfeature class. Enter the following in the NetworkLab_Gradesheet.xlsx.- What gate number is closest?
- How long would it take to drive there, according to the Streets network dataset? (Round to the nearest tenth of a minute, e.g. "5.2 minutes".)
You heard that that some of the gates are closed. You figure that if you find the 3 closest gates, you'd be in luck with at least one. Find these three closest gates and list what gate numbers they are and how long it would take to get to each from you starting point.
(HINT: you'll have to explore the properties of the Closest Facility analysis layer to answer this and the following question.)
Finally, you figure it'd be nice to have a list of all sites within 10 minutes of Environment Hall. How many sites are within 10 minutes of 9 Circuit Dr.?
Can you think of a type of network analysis other than Closest Facility that would answer these questions just as easily? What is the key difference between this type of analysis and Closest Facility?
♦ Exercise 2: Maximizing efficiency posting signs.
*Deer season is around the corner and you've volunteered to post warning signs at each of the Duke Forest gates. You want to finish the job in time to get to the big FOREM party, so you get your geek on and use ArcGIS find the quickest route to hit all the gates. *
Create a new Route network analysis layer.
Load the Duke Forest Access Points as Stops to this analysis layer.
Solve and examine the attributes of the Routes feature layer.
- What is the minimum estimated driving time to hit all gates (not including time to drive to the first gate)? At which gate do you start? At which gate would you end?
- How long would it take if you included that you wanted to begin and end the trip at Environment Hall (9 Circuit Drive)?
♦ Exercise 3: How many Durhamites live within a 5 minute drive to Duke Forest
Duke University is reviewing the public benefits provided by the Duke forest. One of the services is recreation, and they want to calculate how many households are within a 5 minute drive to a nice walk in Duke Forest. As a preliminary analysis, they just want you do this calculation for Durham parcels located with 5 minutes of gates to a Duke Forest access point.
- Create a Service Area network analysis layer.
- Load the Duke Forest Access Points as Facilities.
- Set the Service Area analysis properties to draw lines (not polygons) within a 5 minute drive time to any of the facilities. Disable Use Hierarchy (so you can draw lines).
- Solve.
- Select Durham parcels within 50 ft. of the streets found to be within a 5 minute drive to one of the Duke Forest gates.
- How many Durham Co. parcels are within this drive time?
♦ Exercise 4: Are real estate values higher for homes closer to Duke Forest?
Is there a tangible benefit to living close to Duke Forest? We can scope this question with a network analysis. Here, we'll locate the residential parcels within a 10 minute walking distance to a Duke Forest gate, and compare the mean property value to the mean property value of all residential parcels in Durham County. (This is not a very rigorous statistical analysis, but it's a good start for one...)
Create a Service Area network analysis layer (or re-use the one from above)
Load the Duke Forest gates as Facilities.
In the Service Area analysis properties:
- Set it to generate lines, not polygons.
- Set the time break to be 10 minutes.
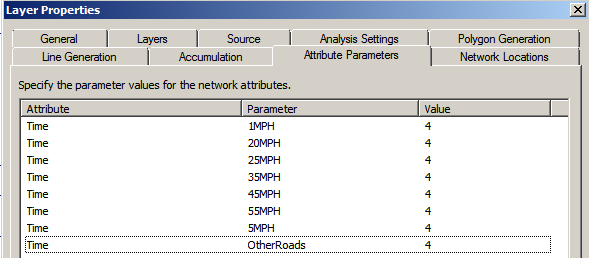
- Set the Attribute Parameters so that travel along all road types is capped at 4 mph (walking speed).

- Solve.
- Select Durham Co. parcels within 50 ft. of the identified streets.
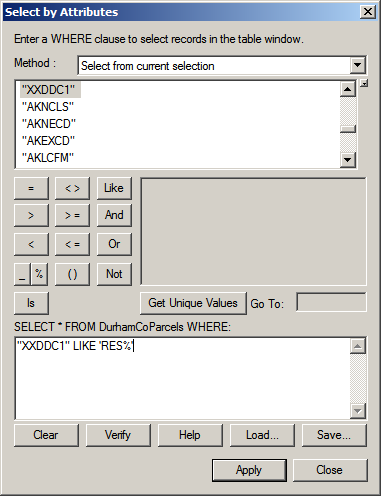
- From these parcels select those that are residential. (Use the query string:
"XXDDC1" LIKE 'RES%')

Open up the attribute and calculate stats on the field
JMTCTM(the sales price of the home) by right-clicking the column header and selectingStatistics.- How many parcels are within a 10 minute walk of a Duke Forest gate?
- How many residential parcels are within a 10 minute walk of a Duke Forest gate?
[Reselect] all Durham residential parcels. Tabulate the average sales price.
- What is the mean value of parcels within a 10 minute walk?
- What is the mean value of all parcels in Durham county?